| Table of Contents |
|---|
By Boards (teams)
Note: This feature is available exclusively in the Team/Cross-team Velocity Chart for Scrum Boards.
When multiple teams collaborate on, e.g., a major release, having sprint metrics segmented by boards (teams) is essential. This allows you to examine individual team data alongside aggregate values, providing insights into anomalies and trends.
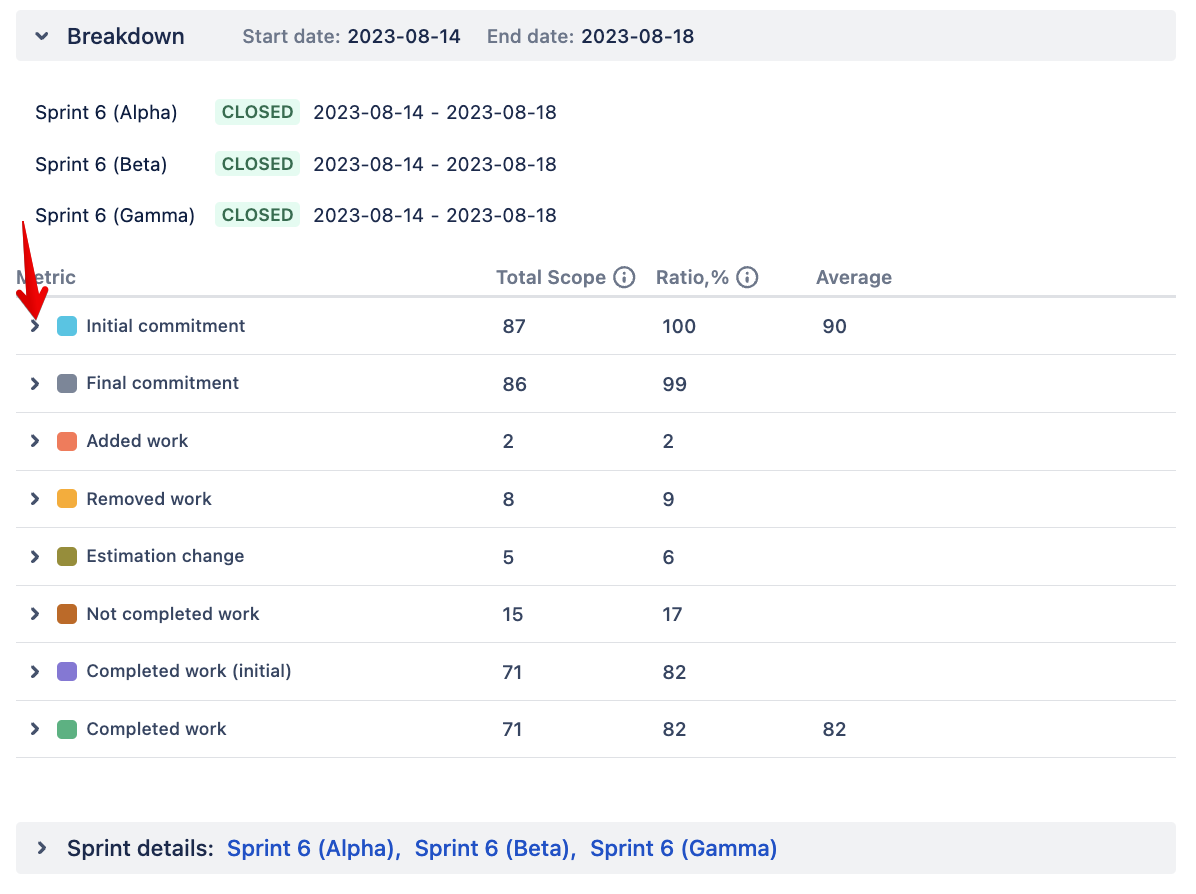
To access the breakdown, select a specific interval on the chart and expand the “Breakdown” section:
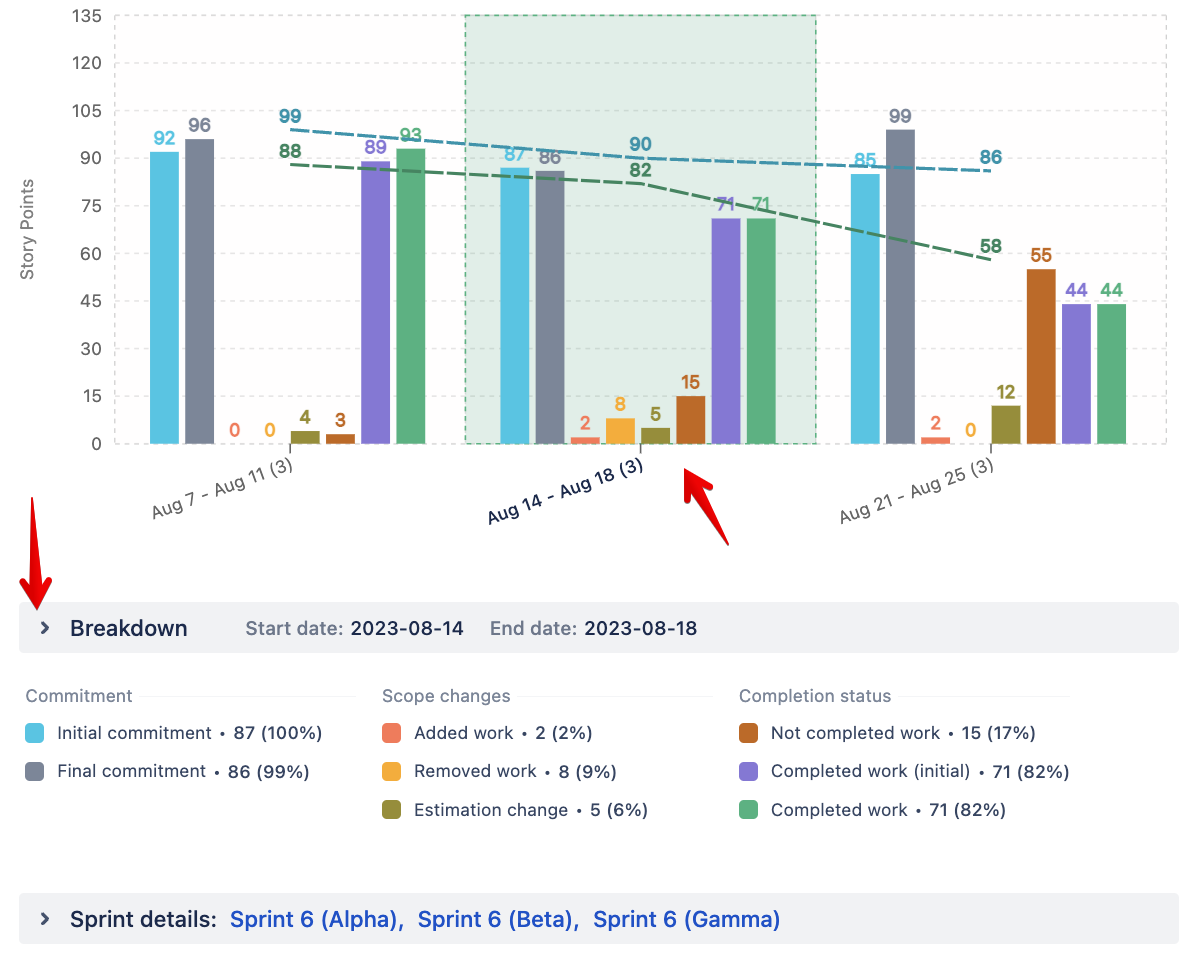
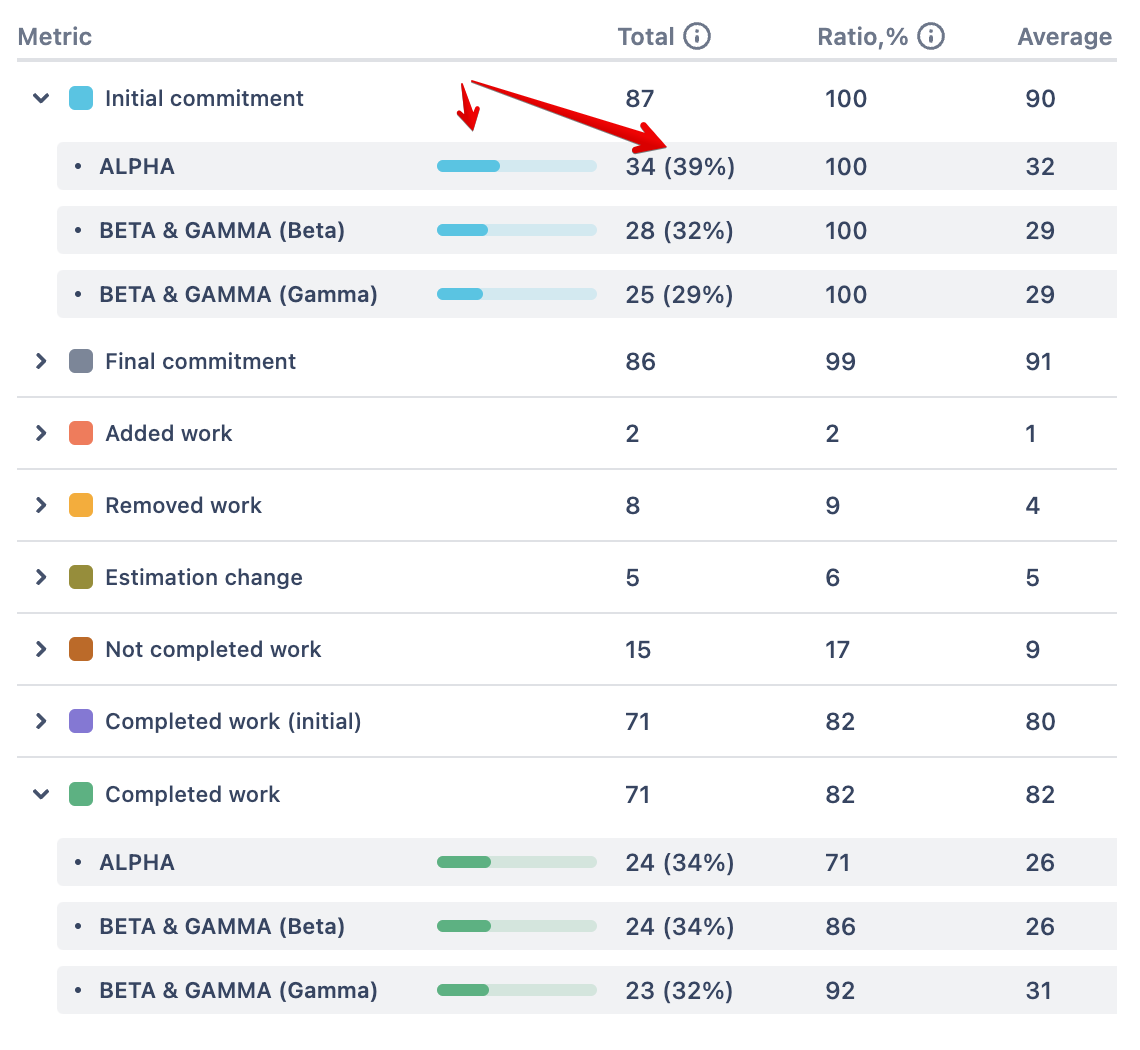
Sparkbars (horizontal bars) offer a visual comparison of each team's contribution to the overall metrics:
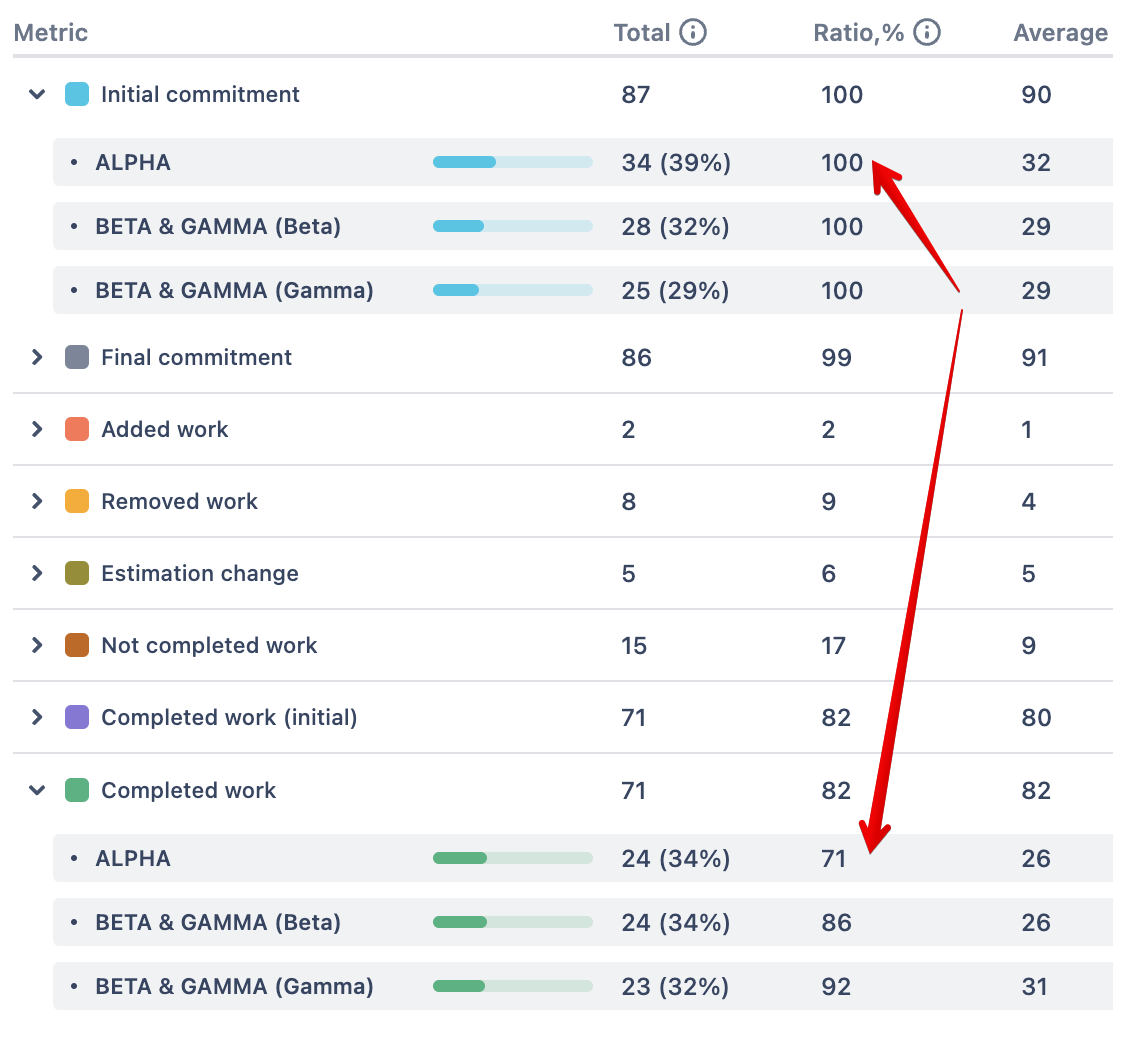
The Ratio column represents the metric's proportion of 100%, where 100% is equivalent to either the Initial or Final Commitment, depending on the configuration of the chart (more details):
To find out how to manage the appearance (on/off, color, order) of metrics displayed on the chart and breakdown, please read this article.